Planogram Compliance Without Manual Audits: A Playbook
Quick answer: Planogram compliance is the degree to which a store's actual shelf matches its approved planogram — correct products, correct positions, correct facing counts. Most retailers can't measure it reliably because manual audits are too slow and too sparse to keep up with shelves that drift out of compliance continuously. Image recognition solves this by turning a smartphone shelf photo into an automated, SKU-level comparison against the digital planogram, run on every visit instead of a quarterly sample. Snap2Insight's own data — consistent with independent industry research — shows a 1-2% sales lift for every 10-point improvement in planogram compliance.
What is planogram compliance?
A planogram is the approved schematic for how products should be arranged on a shelf, cooler, or display: which SKU goes where, at what facing count, on which shelf level. Planogram compliance measures how closely the real shelf in a real store matches that schematic at a given moment.
Compliance is typically expressed as a percentage — the share of planogram-specified positions that are correctly stocked, in the right place, at the right facing count. A shelf isn't compliant just because the shelf "looks stocked"; a fully-faced shelf can still be badly out of compliance if products are in the wrong slots, missing entirely, or overstocked into another SKU's space.
Why manual audits can't keep planogram compliance under control
Planograms don't stay in compliance on their own. Restocking errors, employee shortcuts, competing sales reps, and daily customer handling all push shelves out of their intended layout continuously — industry data shows planograms drift out of compliance at roughly 10% per week even after a clean reset. Measuring that kind of continuous drift with manual audits runs into three structural problems:
- Frequency. A field team visiting a store monthly or quarterly is checking a snapshot, not tracking drift. By the time an audit happens, weeks of degradation have already gone unmeasured.
- Coverage. Manual audits typically sample a subset of stores or SKUs, not the full estate, because checking every shelf position by hand doesn't scale across thousands of stores.
- Subjectivity and cost. A human counting facings and comparing them to a printed planogram is slow, inconsistent between auditors, and expensive to run at scale — which is exactly why, despite the stakes, most brands still don't measure compliance rigorously: fewer than 60% of retailers have any systematic way to measure planogram compliance at all, and CPG marketers who assume their display compliance runs near 70% are often measuring closer to 40% in reality.
Why planogram compliance matters this much
The financial case for closing the compliance gap is well established, from multiple independent angles:
- Sales lift from full compliance. Achieving full planogram compliance after a shelf reset has been shown to lift category sales by an average of 7.8%, alongside an 8.1% improvement in profitability (NARMS).
- Out-of-stock correlation. Research funded by Procter & Gamble found that a 10-point change in planogram compliance shifts on-shelf out-of-stock rates by roughly 1 percentage point — meaning poor compliance and lost availability move together.
- Snap2Insight's own findings. Across our own deployments, we consistently see a 1-2% sales lift for every 10-point improvement in planogram compliance — a finding that lines up directionally with the independent research above, and one we validate on an ongoing basis rather than a single one-time study.
- Average compliance is a low bar. Industry-wide average planogram compliance sits around 60%, with well-managed chains reaching 70-85% and fragmented, independent retail networks often falling below 50% without systematic monitoring — leaving significant, quantifiable sales lift on the table for most brands. And without fixing, compliance dips by 5-10% every week.
Put together: planogram compliance isn't a merchandising detail, it's a direct, measurable lever on category sales and profit — but only if it's actually being measured, continuously and across the full store network.
How image recognition automates planogram compliance measurement - Snap-Insight-Act
Image recognition replaces the audit clipboard with a camera and a model, without changing what a field rep or store associate physically does in-store:
- Snap. A rep or associate photographs the shelf, display, or cooler with a smartphone — the same visit they'd already be making.
-
Insight
- SKU-level recognition. Computer vision identifies every individual product in the photo — not just the brand or category, but the exact SKU, its position, and its facing count.
- Comparison against the digital planogram. The detected shelf layout is automatically compared against the intended, digitized planogram for that store and category.
- Compliance scoring. The system generates a compliance score at the SKU and position level — flagging exactly which products are missing, misplaced, understocked, or overstocked, rather than a single vague "shelf health" number.
- Act. Results are pushed to dashboards and field-rep apps so gaps get corrected on the same visit, and compliance trends get tracked over time, store by store and category by category — turning a one-time audit into continuous measurement.
Because this runs on a smartphone photo already being taken, it scales to full-store-network coverage on every visit, closing exactly the frequency and coverage gaps that make manual auditing unreliable.
The playbook: implementing automated compliance measurement
- Digitize every planogram you want to measure against. Automated compliance scoring is only as good as the reference planogram it compares to — stale or undocumented planograms produce false gaps.
- Standardize photo capture in the existing store visit workflow. Build shelf photography into the visit reps are already making, rather than creating a separate audit trip.
- Turn on SKU-level recognition and automatic planogram comparison, so every photo produces a compliance score without manual review.
- Prioritize corrective action using the SKU-level flags, not a single aggregate score — fixing the specific misplaced or missing SKUs that are actually driving the gap.
- Track compliance trends over time, by store and by category, to catch drift early instead of waiting for the next scheduled visit.
- Tie compliance trends back to sales performance to keep the business case current and prioritize the categories and stores where closing the gap will move the most revenue.
FAQ
What counts as "full" planogram compliance?
Every SKU present in its assigned position, at its assigned facing count, matching the approved planogram exactly — not just a shelf that looks generally stocked.
How much sales lift comes from improving planogram compliance?
Snap2Insight's own data shows a 1-2% sales lift for every 10-point improvement in compliance, consistent with independent research showing an average 7.8% sales lift from achieving full compliance after a reset (NARMS).
Why can't manual audits keep planograms in compliance?
Because compliance degrades continuously — roughly 5-10% per week — while manual audits check only a sampled snapshot, infrequently and inconsistently across a store network.
How does image recognition measure planogram compliance automatically?
By recognizing every SKU and its position in a shelf photo and comparing that detected layout against the digitized, approved planogram to generate a SKU-level compliance score.
What's the average planogram compliance rate across retail?
Roughly 60% industry-wide, with well-managed chains at 70-85% and fragmented independent retail often below 50% without systematic monitoring.
See how this plays out for a real deployment in Snap2Insight's case study on improving out-of-stock and planogram compliance.
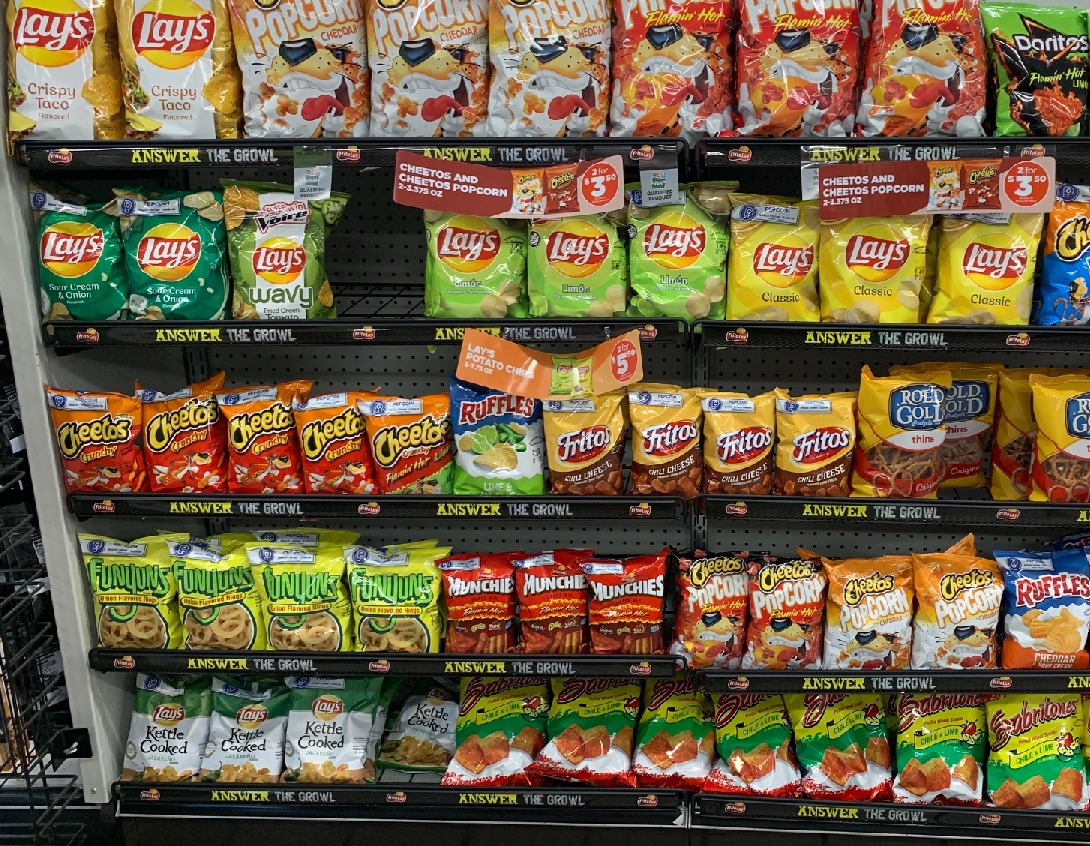
More Knowledge Shelf
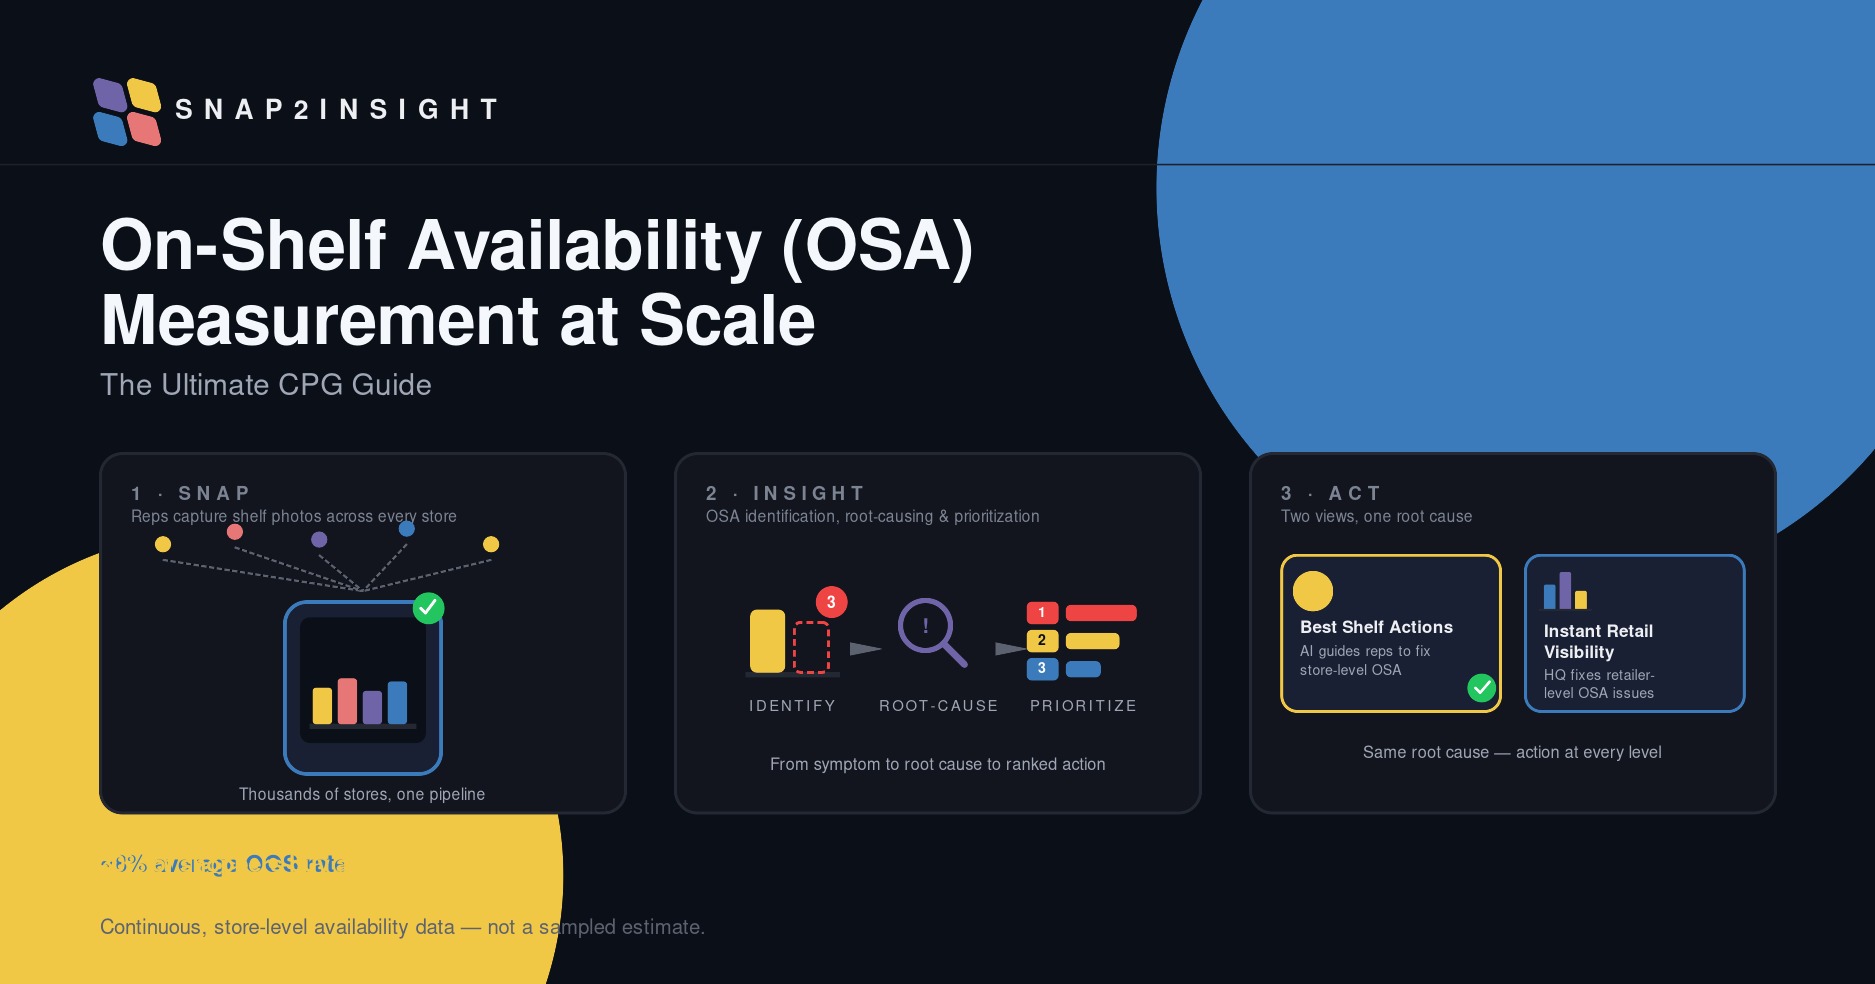
How to Perform On-Shelf Availability (OSA) Measurement at Scale: The Ultimate CPG Guide
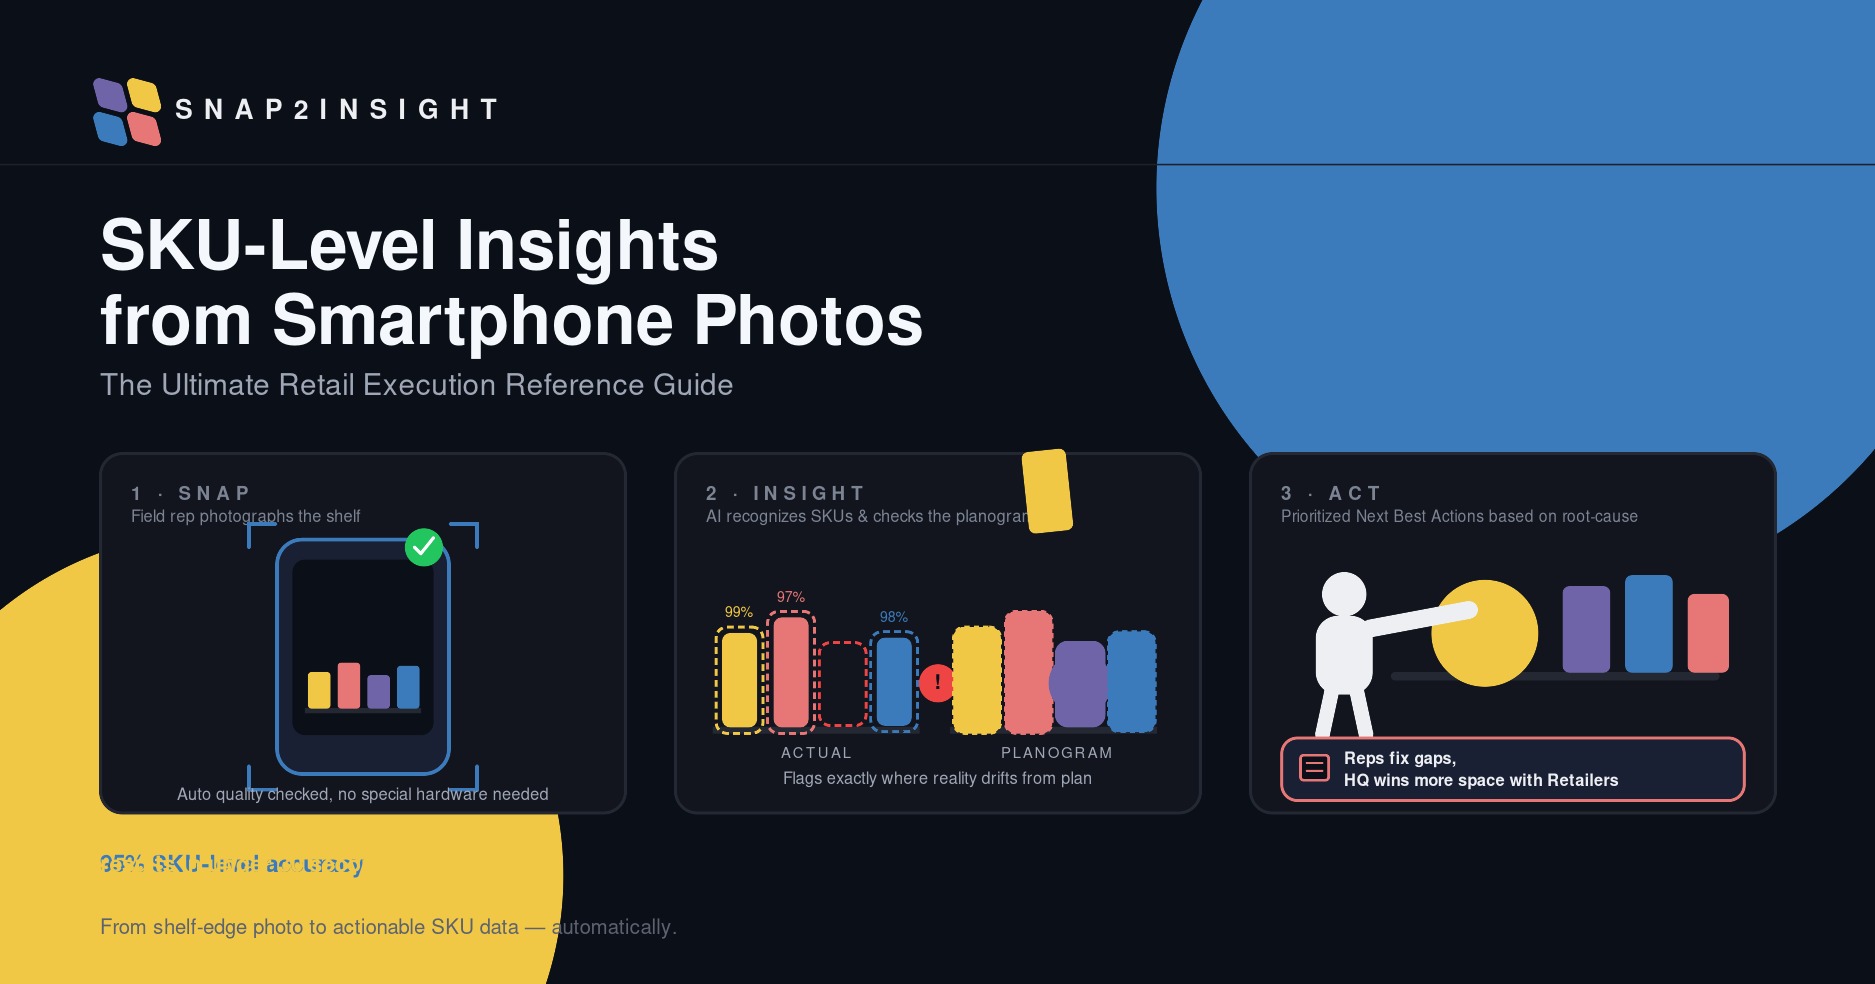
SKU-Level Insights from Smartphone Photos: The Ultimate Retail Execution Reference Guide
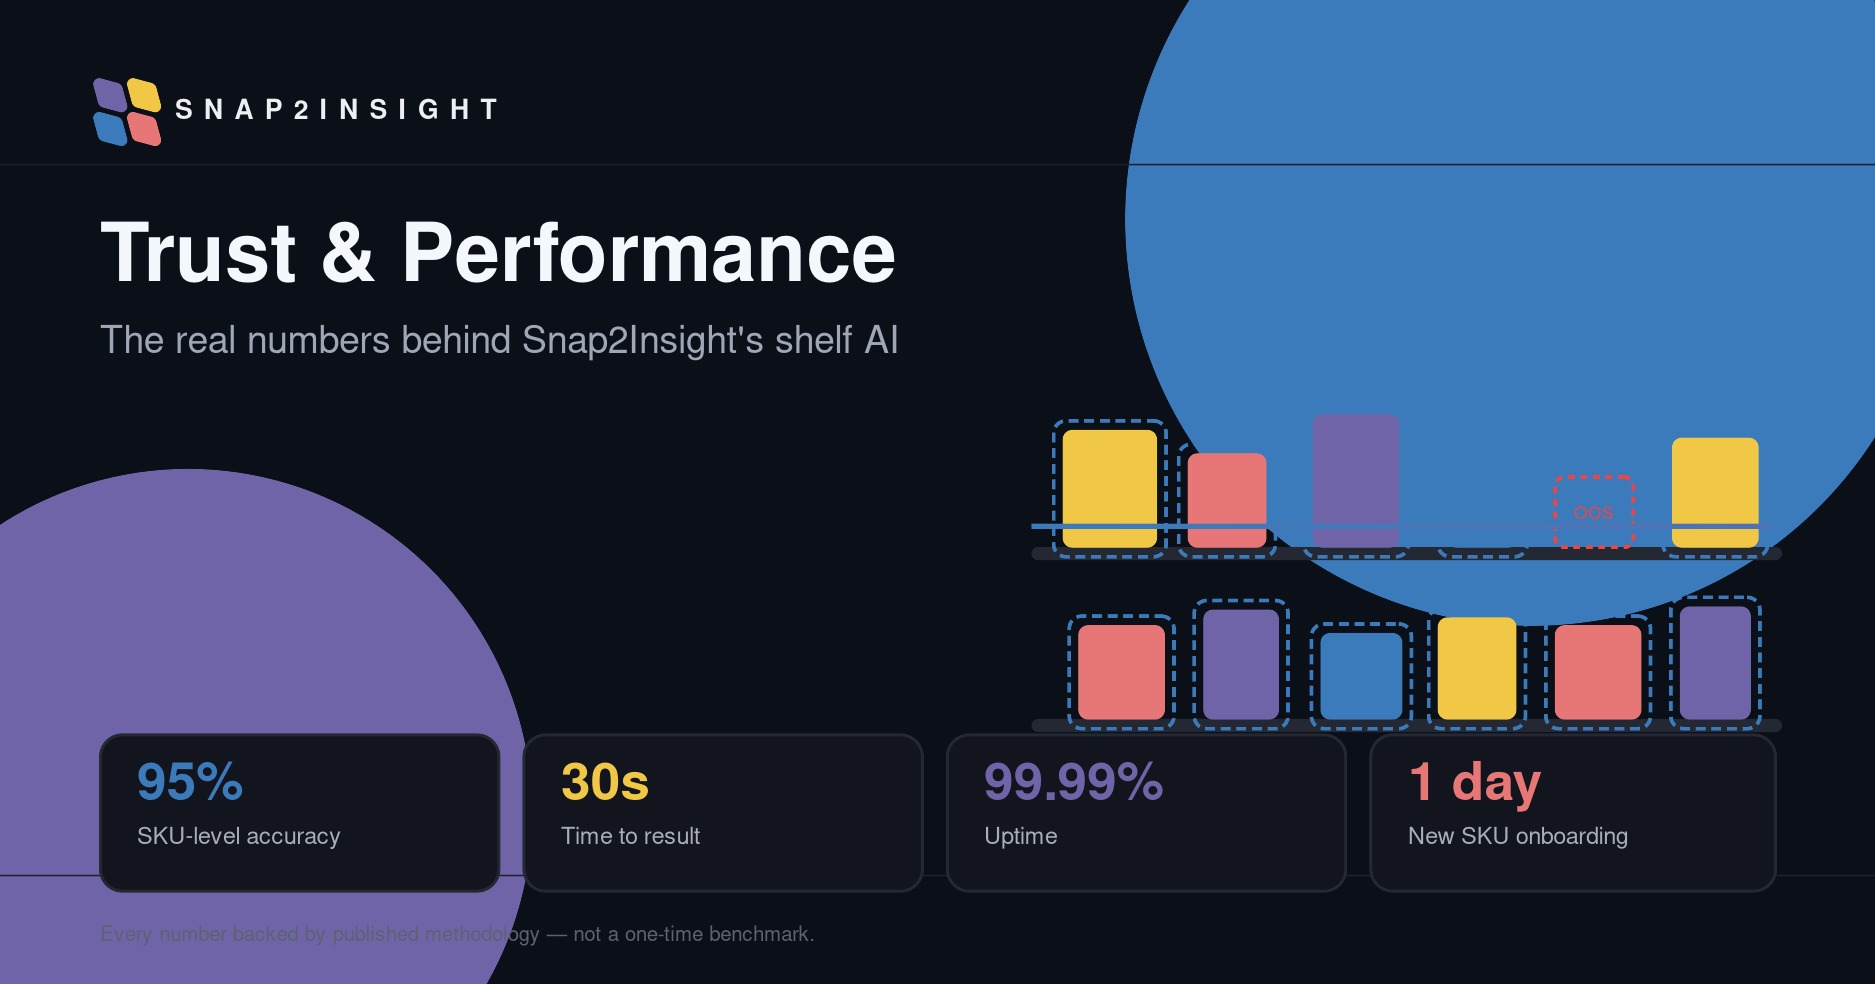
Trust & Performance: The Real Numbers Behind Snap2Insight's Shelf AI

How AI makes the Perfect Shelf possible at Retail
AI-Powered Shelf Visibility: How Snap2Insight Is Transforming Retail Execution

AI Image Recognition for Retail Execution: Frequently Asked Questions

Checklist: Is Your Brand Ready for AI-Powered Retail Merchandising?

How AI Transforms CPG Revenue Growth Management: Smarter Insights for Optimized Retail Execution
Ready to Automate Planogram Compliance?
Talk to our team at Snap2Insight to see how automated, SKU-level compliance scoring can close your compliance gap.