How to Perform On-Shelf Availability (OSA) Measurement at Scale: The Ultimate CPG Guide
Quick answer: On-shelf availability (OSA) measurement at scale means automatically checking whether every SKU is present, in the right place, on every shelf, across an entire retail network — not just a sampled audit. Manual store audits and EPOS-based modeling can't do this reliably: audits don't scale and EPOS can't see phantom inventory. The fix is AI image recognition: field reps (or crowdsourced shoppers) photograph the shelf, and computer vision identifies every SKU, compares it to the planogram, and reports true availability in near real time, across thousands of locations at once.
For CPG brands, an empty shelf is lost revenue. A widely cited global study on retail out-of-stocks puts the average OOS rate at around 8%, and that rate spikes further during promotional windows. When shoppers hit a stockout, roughly 30% buy a competitor's product instead, and another 20% leave the store without buying anything at all.
Measuring OSA across thousands of retail locations, dozens of banners, and hundreds of SKUs is an immense operational challenge — legacy, manual methods simply cannot keep up with real-time inventory velocity. To measure and optimize OSA at scale, enterprise brands need to shift from subjective checklists to an automated, data-driven approach. Here's how to build one.
1. Why Traditional OSA Measurement Fails at Scale
Brands have historically relied on two methods to track availability, and both have critical blind spots:
- Manual store audits. Having field reps or third-party brokers manually check OSA at shelf is error-prone, costly, and doesn't scale. Manual audits are highly susceptible to human error, and they pull valuable time away from reps who could otherwise be selling or merchandising.
- EPOS (Electronic Point of Sale) modeling. Using sales velocity data to infer out-of-stocks is cost-efficient but reactive, and it doesn't capture true on-shelf availability. If a product stops selling, the algorithm assumes it's out of stock — but it can't detect phantom inventory, where the system shows units in stock that are actually lost in the backroom, damaged, or misplaced. EPOS also has limitations with predicting out of stocks for non fast moving goods.
2. The Solution: Scaling OSA with AI Image Recognition
To scale measurement without exploding field costs, leading brands deploy AI image recognition (IR) and computer vision (CV). By using the smartphone cameras field reps already carry, automated image analysis bridges the gap between physical shelves and digital dashboards.
Instead of manually logging OSA status for each product, a field representative captures photos of the category aisle. The AI platform automatically identifies each SKU, cross-references it against the store's authorized product list, and updates OSA metrics instantly — no manual data entry required.
3. Step-by-Step Blueprint for Scalable OSA Deployment
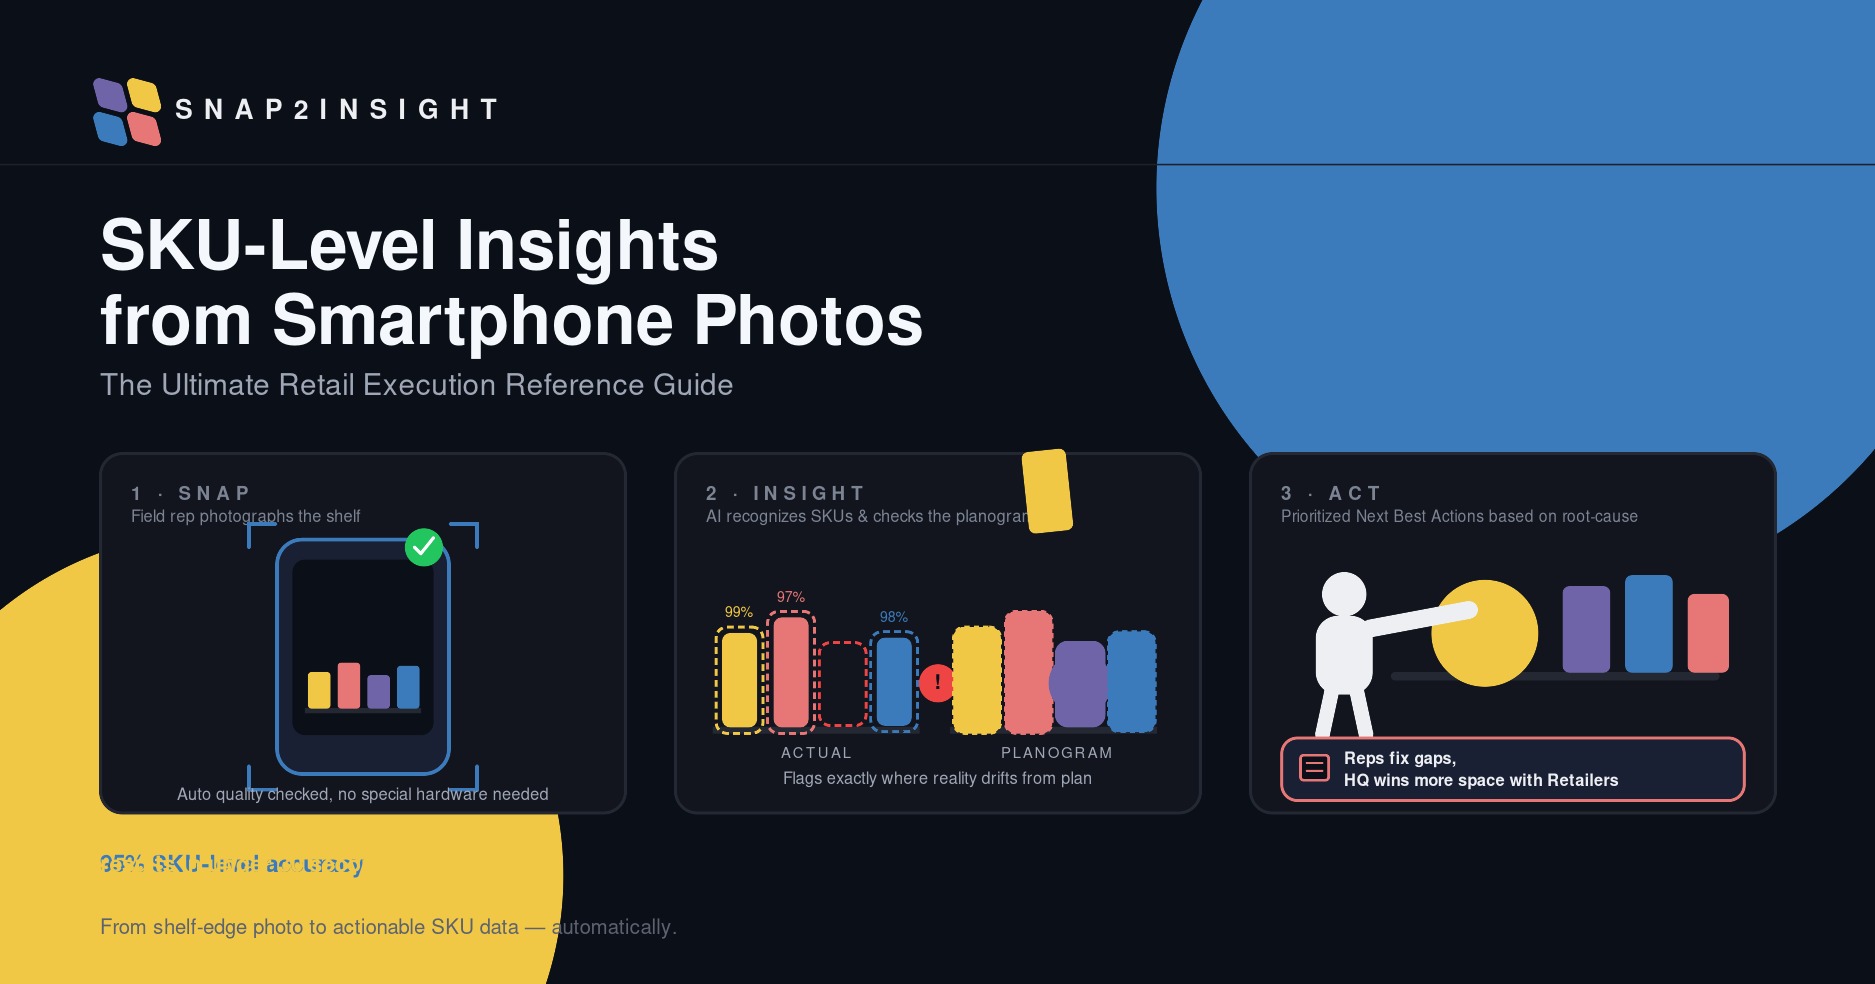
Implementing an automated OSA measurement system requires an organized, repeatable operational flow. At Snap2Insight, we use a Snap, Insight, Act framework to execute this across thousands of retail locations daily.
Step 1: Snap — Uniform Field Data Capture
Field representatives walk the category aisle, taking overlapping, high-resolution photos using standard mobile devices. The software handles poor lighting, varied distances, and minor angle distortions automatically. Capture doesn't have to rely on dedicated reps alone — it can also be crowdsourced, with store associates or shoppers submitting shelf photos directly.
Step 2: Insight — AI Analysis
Images upload instantly to a centralized cloud engine. AI image recognition algorithms stitch the images into a complete panoramic view, identify individual SKU facings, and compare the current shelf state against corporate planograms and historical distribution targets. Using store level inventory data, root-causing to see if inventory is available but not on shelf or if it's a supply chain issue can be tracked. Sales data is used to prioritize Best Shelf Actions by dollar opportunity value.
The processing pipeline generates two outputs simultaneously:
- In-store alerts (Best Shelf Actions): Real-time push notifications go to the rep's device with a prioritized list of missing SKUs and why, so they can fix the issue before leaving.
- Executive dashboards (Instant Retail Visibility): Aggregate OSA performance metrics flow directly to headquarters to identify trends across stores/skus and spot highest opportunity store execution issues.
Step 3: Act — Fix at Store, Win at HQ
Equipped with real time Best Shelf Actions, Field Reps fix issues at the store — including stocking product at the shelf from backroom, working with retailer to zero out phantom inventory issues, trigger ordering or getting the department manager to allocate more space.
Corporate (Headquarters) uses the instant shelf visibility they never had access, to coach their field reps, work with retailers to negotiate better execution and shelf space.
4. Key Metrics to Track for True Scale
Measuring OSA is about more than a simple yes/no presence check. To drive long-term supply chain and merchandising improvements, your platform needs to calculate these granular sub-metrics:
| Metric | Focus Area | Why It Matters at Scale |
|---|---|---|
| True Out-of-Stock (OOS) | Total physical absence of a target SKU | Triggers immediate reorders or warehouse-to-shelf delivery workflows |
| Phantom Inventory Rate | SKUs showing positive inventory in ERP/POS systems but zero physical shelf presence | Cleans up systemic data errors that break automated ordering algorithms |
| Share of Shelf (SOS) Drift | Slow shrinkage of total facings over time due to competitive encroachment | Protects prime physical shelf real estate guaranteed by trade agreements |
| Promo Display Compliance | Availability of secondary displays, endcaps, or side-wings during marketing events | Ensures maximum return on expensive trade marketing spend |
FAQ
What is on-shelf availability (OSA)?
OSA is the measure of whether a product is actually present, visible, and purchasable on the shelf at the moment a shopper looks for it — distinct from inventory records, which can be wrong.
What causes phantom inventory?
Phantom inventory happens when a store's ERP or POS system shows units in stock that don't physically exist on the shelf — because they're lost in the backroom, damaged, miscounted, or misplaced. EPOS-based OOS models can't detect this because they rely on system records, not physical shelf checks.
Why can't EPOS sales data alone measure true OSA?
EPOS modeling infers stockouts from a drop in sales velocity, which is reactive and blind to phantom inventory — a product can show as "in stock" in the system while the shelf is physically empty.
How much revenue do CPG brands lose to out-of-stocks?
With average OOS rates around 8% and roughly 30% of shoppers buying a competitor's product and 20% leaving the store when they hit a stockout, unaddressed OOS translates directly into lost sales and, over repeated instances, permanent brand switching.
How does AI image recognition measure OSA at scale?
Field reps or crowdsourced shoppers photograph the shelf; computer vision identifies every SKU and facing in the image, cross-references it against the authorized product list and planogram, and reports true on-shelf availability instantly — across as many stores as photos are captured in.
Accelerating Retail Growth with Snap2Insight
Scaling your on-shelf availability measurement doesn't mean hiring more people — it means arming your existing workforce with smarter tools. Snap2Insight's AI image recognition (IR 2.0) platform removes the friction from field data collection. By transforming simple smartphone photos into precise, SKU-level insights, we help CPG brands reclaim lost sales, optimize delivery schedules, and command the shelf edge with confidence.
Want to eliminate phantom inventory and scale your retail execution? Let's discuss how an automated image recognition workflow can transform your business.
More Knowledge Shelf
SKU-Level Insights from Smartphone Photos: The Ultimate Retail Execution Reference Guide
Planogram Compliance Without Manual Audits: A Playbook
Trust & Performance: The Real Numbers Behind Snap2Insight's Shelf AI
How AI makes the Perfect Shelf possible at Retail
AI-Powered Shelf Visibility: How Snap2Insight Is Transforming Retail Execution

AI Image Recognition for Retail Execution: Frequently Asked Questions

Checklist: Is Your Brand Ready for AI-Powered Retail Merchandising?

How AI Transforms CPG Revenue Growth Management: Smarter Insights for Optimized Retail Execution
Ready to Scale Your OSA Measurement?
Talk to our team at Snap2Insight to see how AI image recognition can eliminate phantom inventory across your store network.